Reading an El Niño map starts with what was measured
Satellite records reveal changes in the Pacific. Local planning also needs forecast probabilities, timing and context.

3 min read
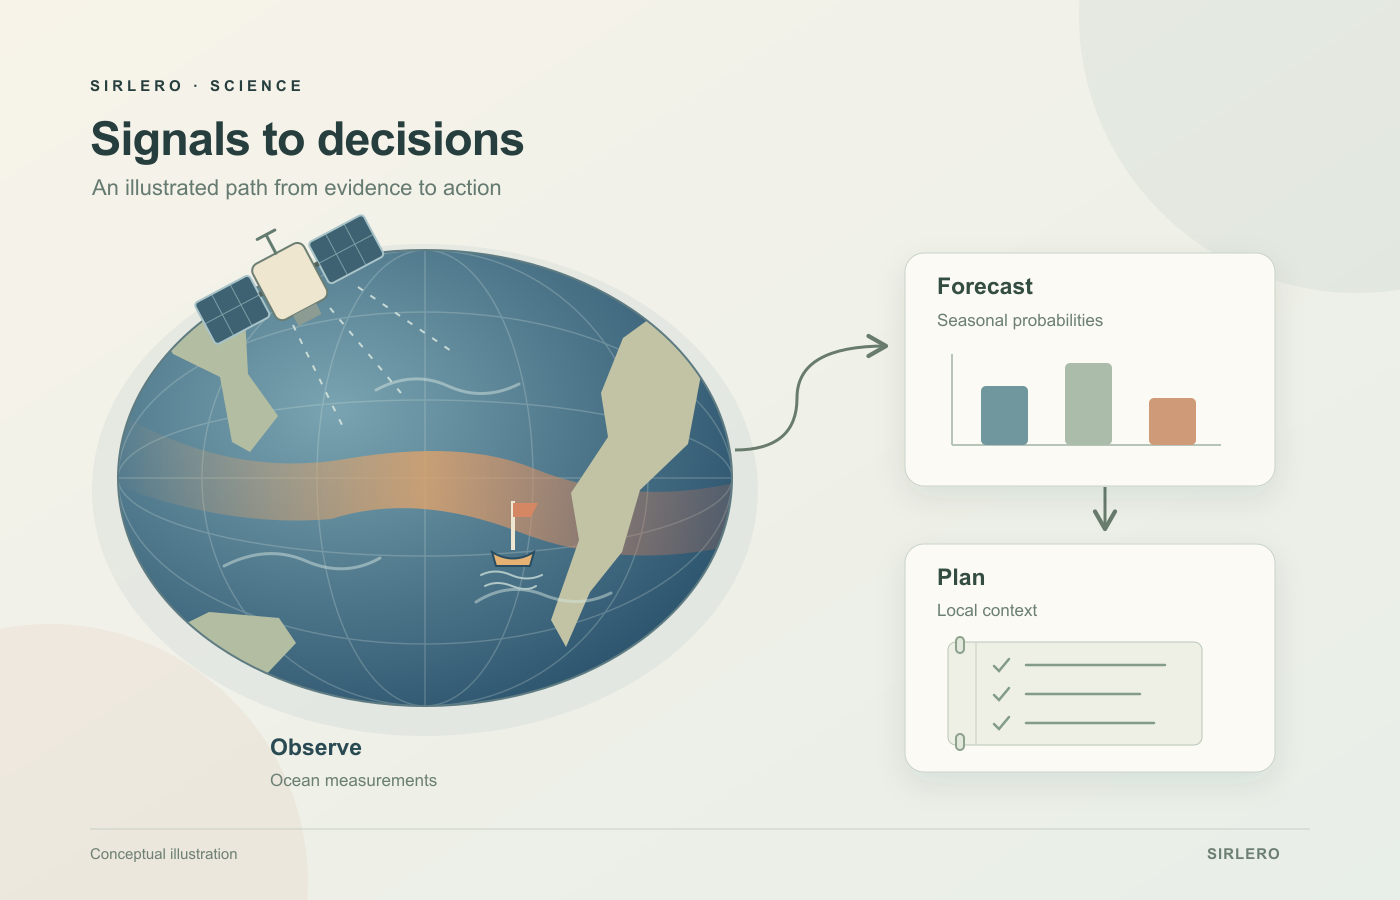
An ocean map can make a distant change look immediately understandable. A colored band crosses the Pacific, and the eye starts looking for consequences closer to home. Reading that map carefully begins with a more modest question: what does its color represent?
Ray Fernandez’s October 30 Forbes article examines the technologies monitoring the 2026 El Niño and their potential value for governments and businesses. The subject offers a useful way to separate three tasks: observing a change, estimating future conditions and choosing a response.
Read the instrument before reading the colors
NASA’s October 15 account compares the same months in 2025 and 2026 using sea-surface temperature, sea-surface height and ocean-color products. It describes altimetry tracking height, while PACE’s Ocean Color Instrument supplies the color data. Each view describes a different aspect of the ocean.
ESA’s June explanation gives another useful reading aid: an anomaly describes a difference from a reference average. Its temperature example used June 1–7 against the 1991–2020 average for that period. ESA also explains that warming seawater expands, contributing to sea-level changes. Temperature and height therefore offer related, complementary evidence.
For a reader, the practical habit is to check the quantity, legend, reference period and observation date before interpreting a striking patch. The reference used in one illustration should not silently become the assumed baseline for every other map. A comparison between two years and a departure from a long-term average communicate different things.
A seasonal outlook describes a range of outcomes
NOAA’s guide to U.S. monthly and seasonal outlooks explains that they assign probabilities to average temperature or precipitation falling in the upper, middle or lower third of the local climate record. They do not specify the actual temperature or precipitation total that will occur. The period and the location are part of the forecast’s meaning.
A favored wetter category is therefore useful as a statement about the season’s average outcome. It is not a calendar of rainy days. That difference helps explain why a broad climate signal and an individual day’s weather should be read at their own timescales.
Give the forecast a decision and a review date
Consider a hypothetical community garden preparing for the next growing season. A forecast might prompt a discussion about water storage, drainage or when to revisit planting plans. The useful follow-up is specific: which choice remains open, what local information is still missing, and when will the group check again? Those are planning questions, rather than recommendations for a particular place.
Our reading is that this final connection deserves as much attention as the map. Better observations can improve the evidence available to a planner, while the decision still depends on the place, the task and the consequences of acting early or waiting.
El Niño monitoring becomes easier to understand when each step keeps its identity. An instrument supplies observations. An outlook describes possible conditions over a stated period. A local plan connects that evidence with choices someone can review as more information arrives.